EUR/USD has risen sharply in recent days. From last week it was an increase of about 3 figures, which is a considerable achievement for the average volatility so far. The weakening of the dollar is also accompanied by an improvement in global investment sentiment, flowing capital to equity markets (including emerging markets) and negatively correlated with dollar commodities.
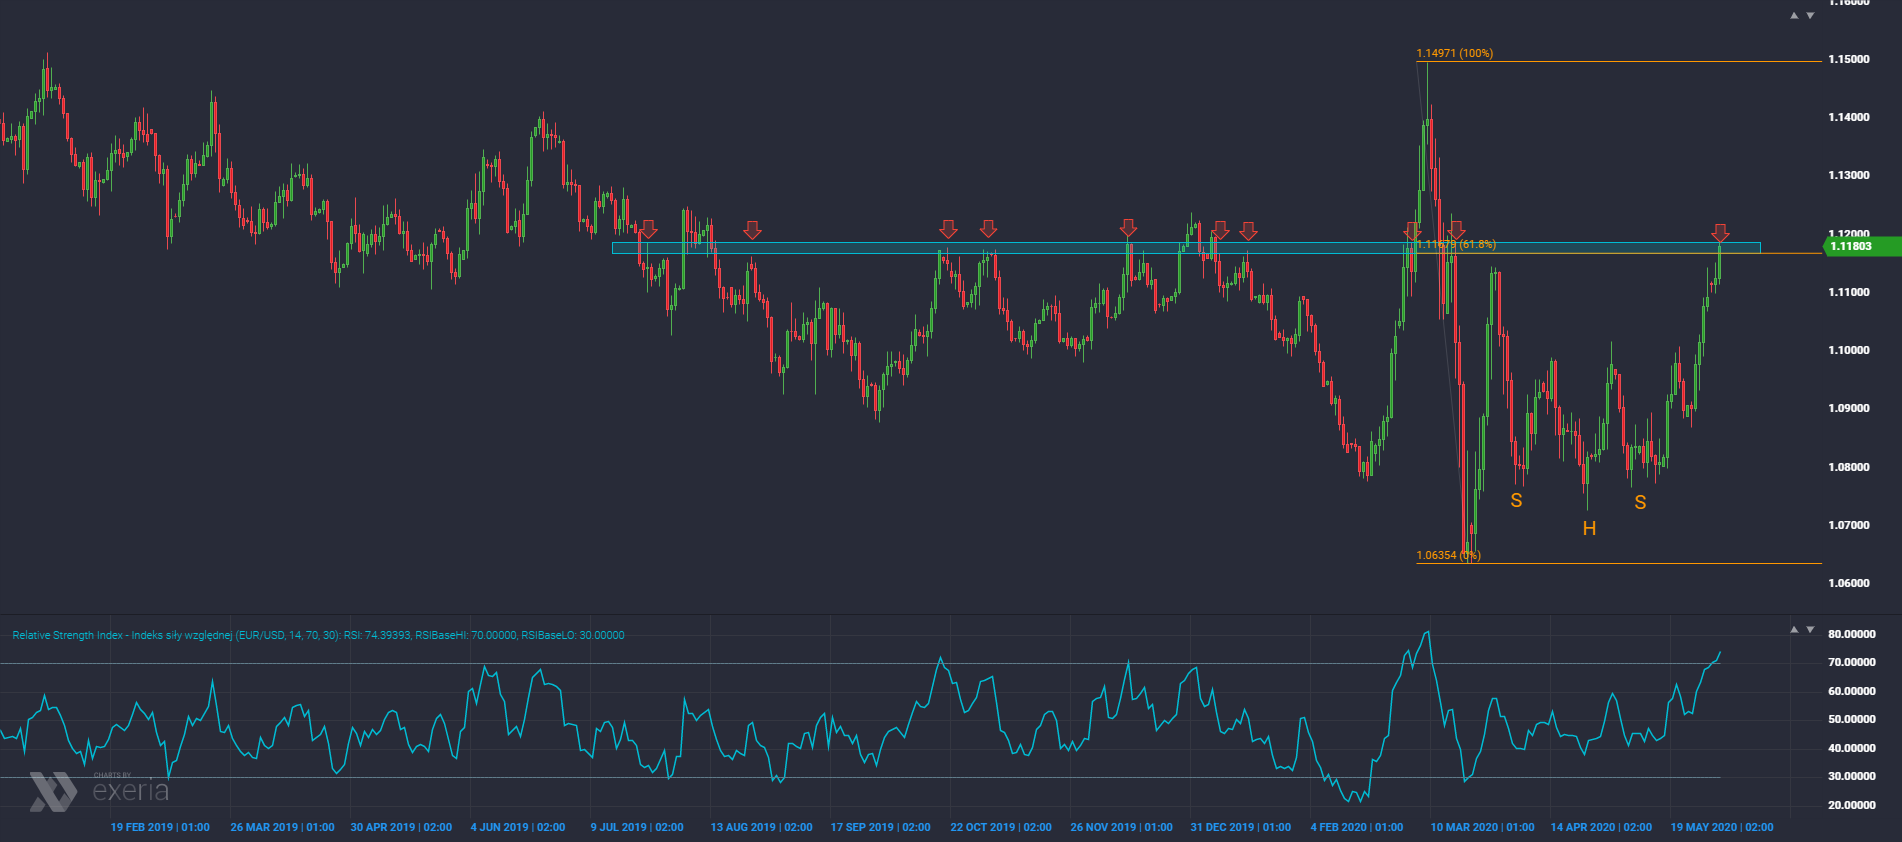
If we look at the daily chart, EUR/USD has just reached a quite important resistance area at 1.1180-1.1200. In the past, sellers have appeared here many times, as can be seen from the red arrow markings. In addition, 61.8% Fibo also appears here. Bears may come here again. So it is a place where it is worth taking a closer look at what is happening at lower intervals. If there were some ending patterns to be created (e.g. head & shoulders or pin bar) at current levels, this could be a very good place to join the bears, with the target level even towards 1.10.
The euro is the most overbought against the dollar
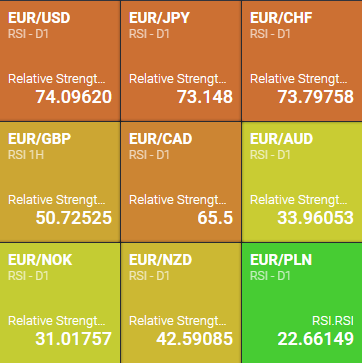
Using the heat map, we can visually look at the pairs of the euro in relation to major currencies and a simple RSI indicator (in the daily interval). It turns out that EUR/USD is currently the most overbought pair and the indicator has already exceeded the signal level of 70. Combining such overbought with reaching a key resistance area is usually a strong warning for holders of long positions.