Level 13000 points on DAX has been causing problems for the bulls for a long time. This can be seen on the first weekly chart.
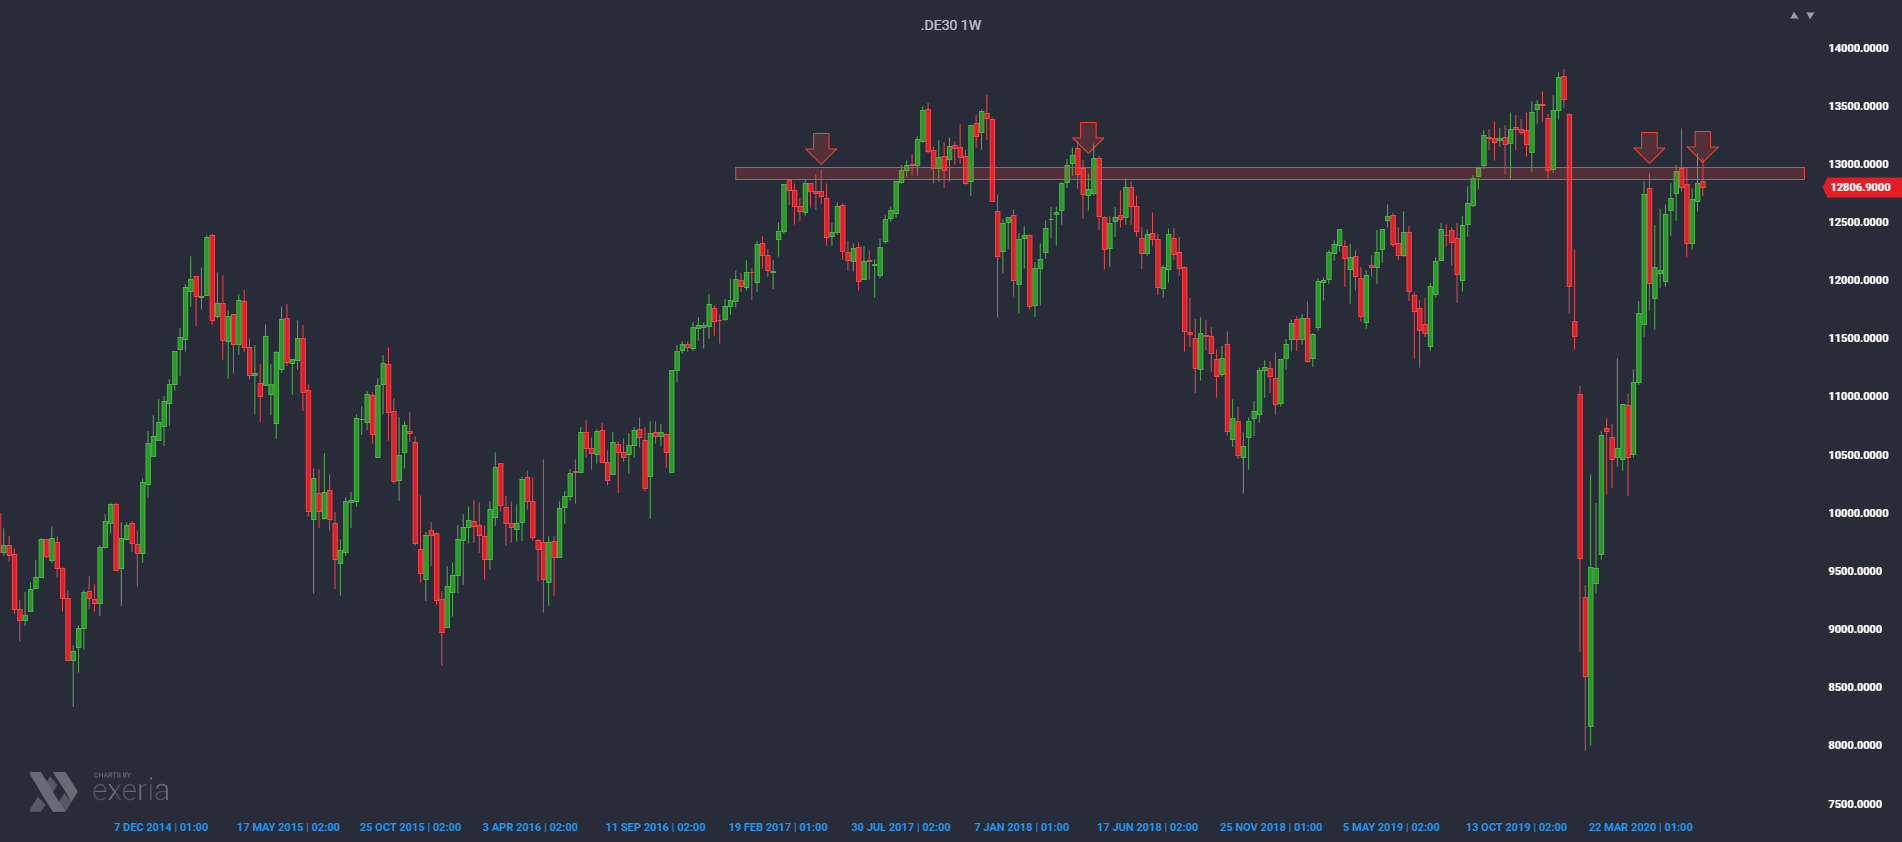
This is where a lot of market reaction has occurred, both from below and above. This area has also entered the game in recent weeks, and fierce gameplay is taking place around it again. As we know, when the market reaches resistance, it is worth looking at what is happening in such a place with the price. Already from this weekly perspective, it can be seen that within the resistance zone marked with a red bar there is a chance to create a distribution pattern based on the idea of a head and shoulders. The current position is perfect for the right arm.
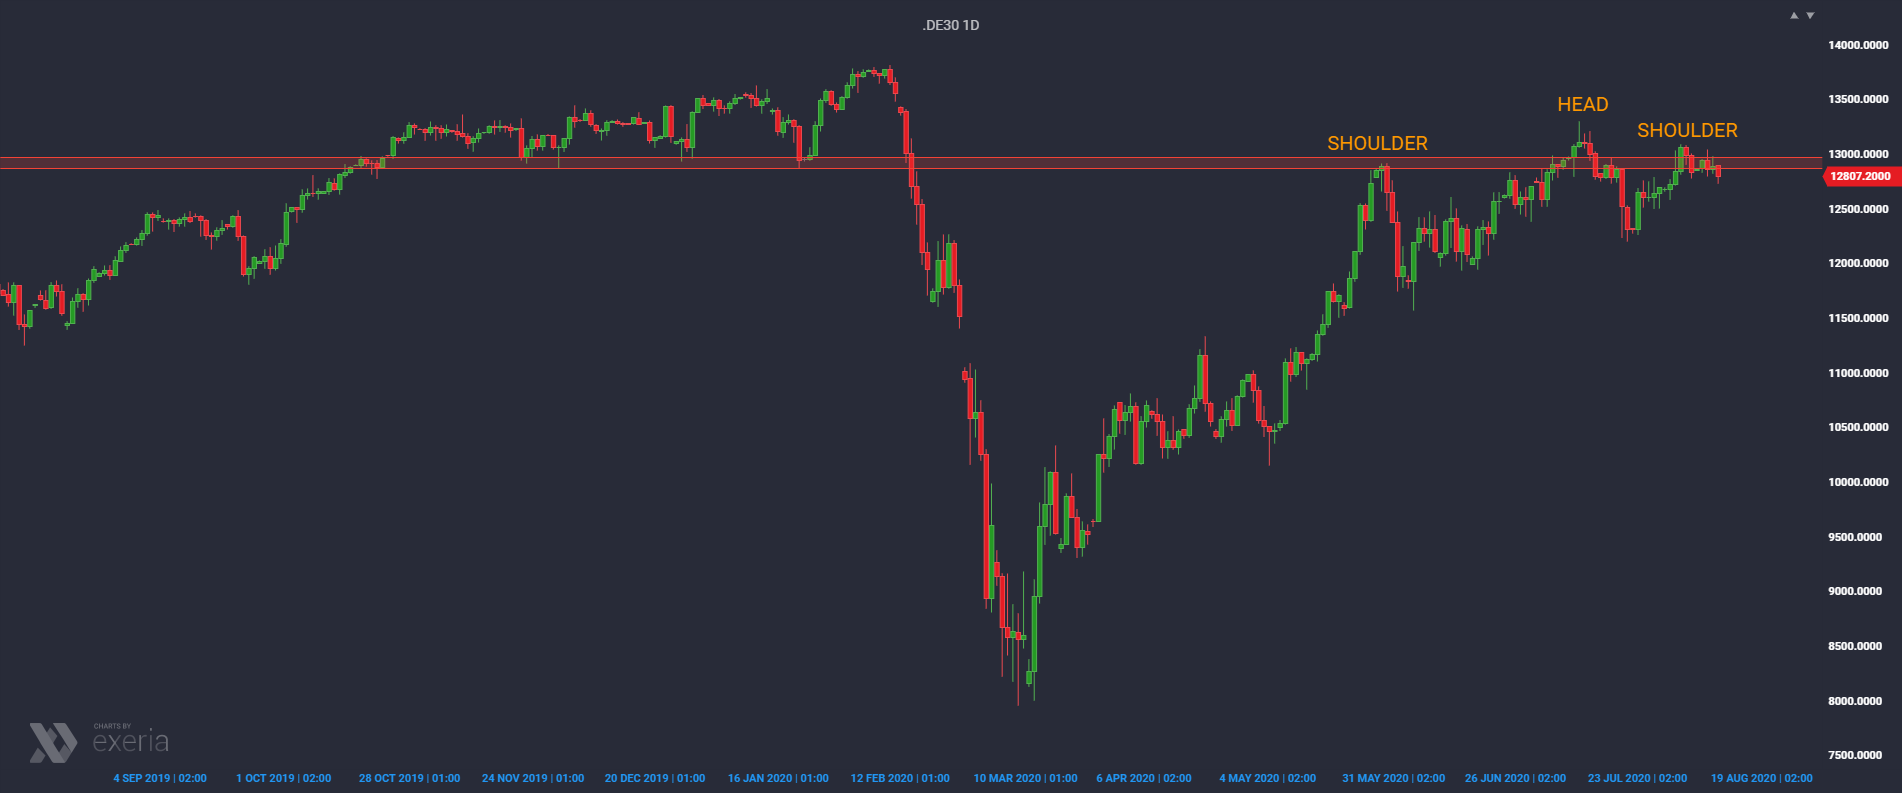
This pattern is even more precise on the daily chart. As you can see, the sellers would definitely have to take control and expand the right arm. Some market participants, however, try to take positions within the formation of the right arm.
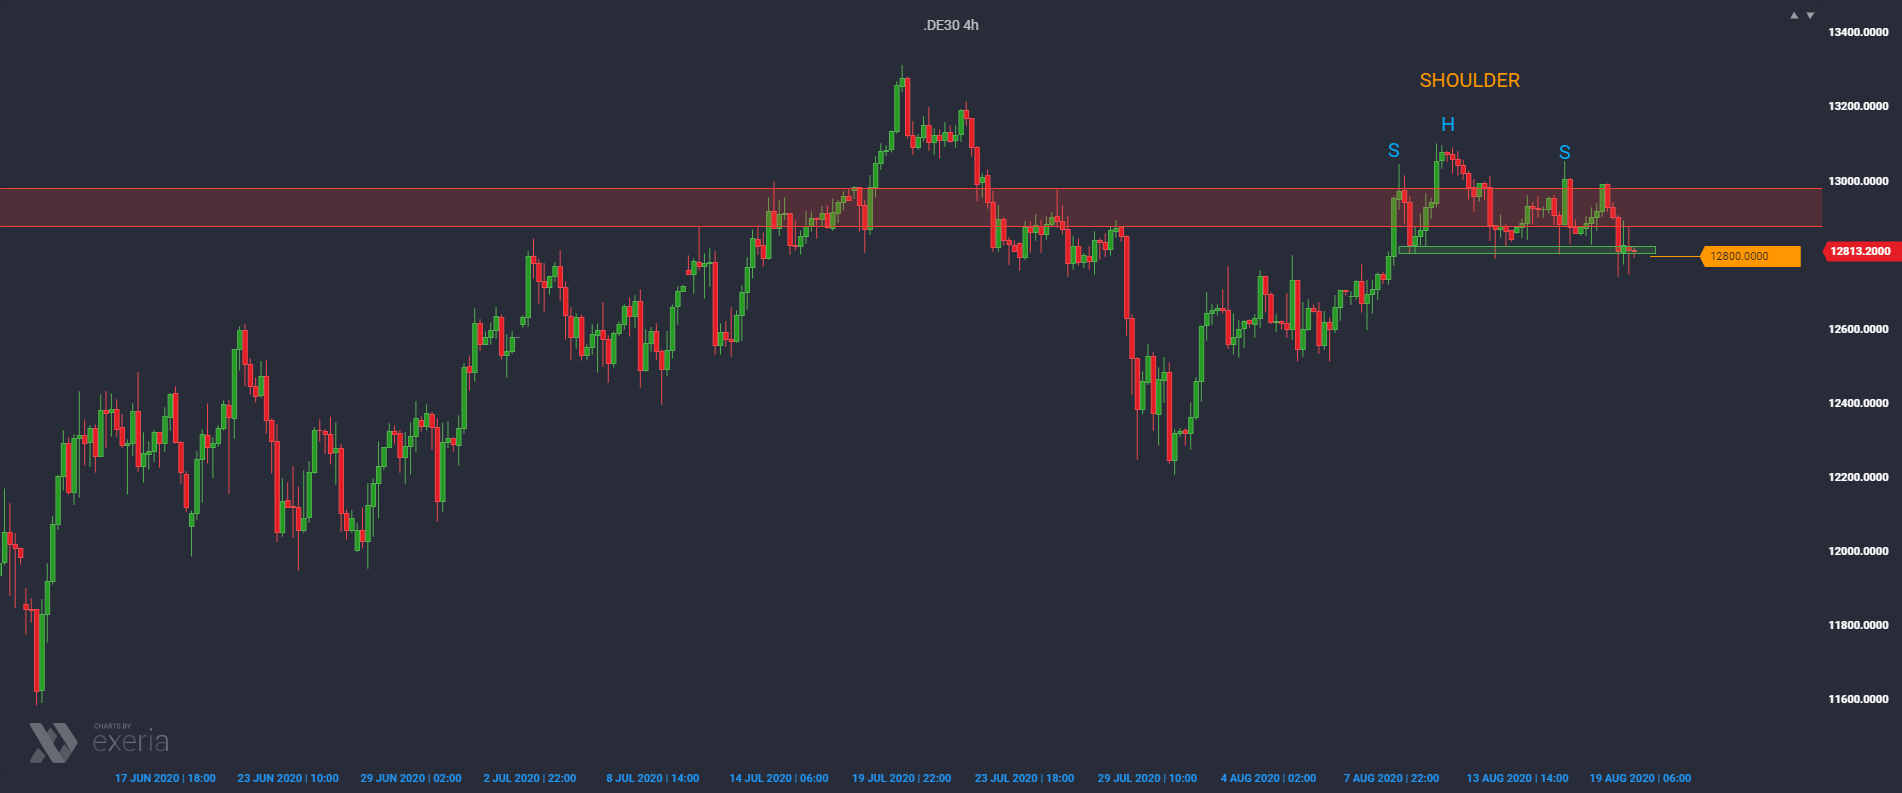
By looking at an even lower interval, we can take a closer look at what is happening at the top of the potential right shoulder. And here it gets very interesting, because you can see here a fully formed, smaller pattern of the head and shoulders, complementing the negative meaning of the whole. The level of 12,800 points is of great importance here, because its final breakdown, preferably at the end of the day, could already be treated as an invitation to join the bears. The likelihood of moving south along with the entire H&S pattern from the weekly chart would increase significantly.