When looking at the situation on the main indicies, currently CAC40 technicians pay more and more attention. If we look at the CFD’s weekly chart, we are now in a very sensitive place. Around 4600 points in the past they have proved to be a turning point many times. In more cases, the sellers showed an advantage here. This can also be seen quite clearly on the weekly chart, where bear attacks are marked with red arrows.
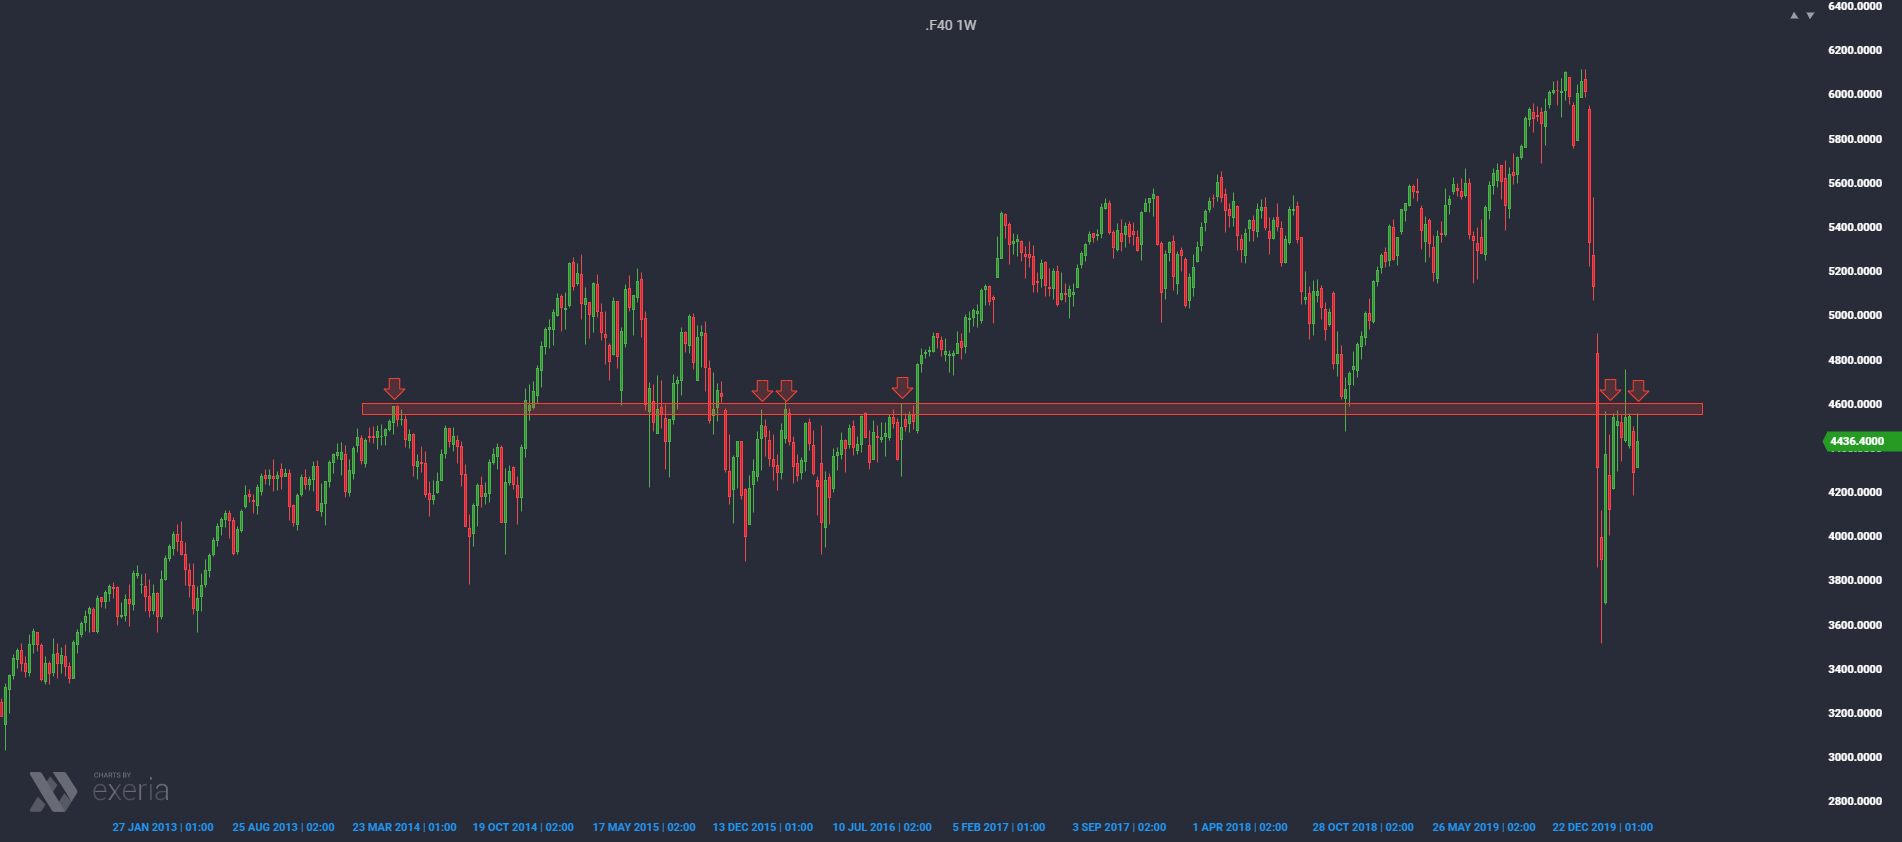
The last rebound after the memorable wave of panic in February and March was stopped precisely in this area and so far the bulls are not able to go higher. Attention is also drawn to a negative-shaped candle (similar to a pin bar) that appeared three weeks ago. The market then tried to break through an area of 4,600 points, but ultimately it ended in a high, upper shadow (the trap of bulls buying breakout and continuing rebound). After the last retraction, we are currently approaching this area again and this is where the most interesting begins.

If we go lower with the interval, then the market fluctuations under this resistance begins to take a pattern resembling a head and shoulders. This is obviously a bearish sign, but most importantly, it appears in a very specific place, which significantly increases the chances of implementing the decline scenario. Many traders, seeing this setup, open short positions already in resistance, i.e. at the top of the right shoulder (at the cost of a slightly higher risk, you get great potential for movement to the south). The market already in the first part of today reacted in the area of resistance, so the local top could already be determined.