Charts which support your service’s development
Charts are a surprisingly efficient tool for market analysis both on your computer and smartphone.
Exeria charts make technical analysis possible for your clients as well as checking the results of current or historical records. These features will perfectly support autonomic development of your service. Charts hold back clients outflow to other websites and also make income from advertisements possible. Moreover, you will be pleased by the fact your clients are given a highly efficient tool for market analysis both on your computer and smartphone.
19 most interesting technical parameters of Charts

1. Technical analysis
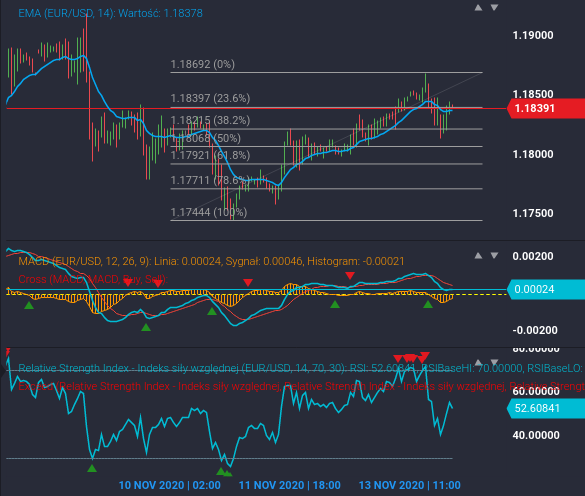
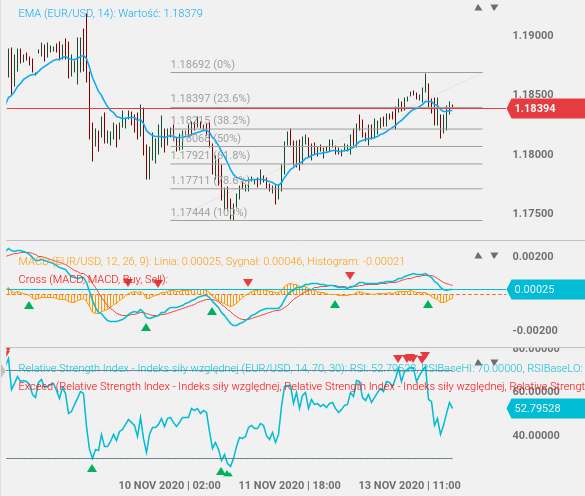
Users of your service will be able to use dozens of indicators and graphic tools for making technical analysis, adding their own analysis and studies using tools such as buttons, forms and actions under a right mouse click.
2. Wide range of chart’s type
Users will be able to use different types of charts (linear, bar and candlestick) as well as different time horizons (5 minutes, …, 1h, 1 day, … 1 month).


3. Quotes along with charts
The package with charts also includes the quotes of the most popular instruments from the forex, crypto and equity markets.
4. Responsiveness
The chart is operated by any computer, tablet or smartphone. The way of the menu’s construction was specially designed so that the user would be able to use the charts easily both on the computer and any touch screen.


5. Smart Menu
Smart Menu appears solely at the moment of using the charts, making it possible for users to get as much screen space as possible, for example when a lot of charts are observed simultaneously.
6. Easy installation
To add charts to one’s own website it is enough to click and paste independently the code which is available along with instruction from Exeria.com. In the case of library installation, this process can be activated with the assistance of Exeria experts.


7. Possibility of building your own indicators
A unique feature called Function makes working on a series of data (i.e. adding, subtraction, multiplication, division, displacement) possible. Using these functions a user can make his/her own indicator even without programming skills.
8. Templates of charts
A user can utilize ready-made templates of charts and automatic analysis. Instead of using single indicators, a user can utilize a predefined set.


9. Smart Indicators
A user is able to build indicators using optional data series of charts. For instance calculating the average from prices of openings, closings, maximal and minimal prices as well as building RSI from the average on a chart.
10. Smart Panel
A user can choose panels where he will draw indicators and move panels up and down.


11. Possibility of additional data upload
A user can add a great amount of data to a chart. The chart does not “jam”, and moreover charts are downloaded ultra fast comparing to other solutions.
12. Possibility of the chart’s opening on an entire screen
Charts are equipped with a button that makes possible the opening of a chart in full screen mode.

13. Investment strategies
A user can apply a popular investment strategy to a chart that will show the buy, sale or exit signals.
14. Searching of a candlestick pattern
System is able to uncover candlestick formations of different kinds.


15. Auto refreshment
Chart is actualized up to date. Refreshment happens automatically. Chart is constantly getting current data and a user is able to observe charts without actualizing it.
16. Unlimited number of indicators
A user is able to add many indicators to a chart simultaneously. Subsequent indicators can be added without limitations.


17. Data integrated with charts
Data is integrated with charts. You can choose live or delayed data. Data from the Forex and the CFD market (currency indexes, products, auctions) as well as data from main cryptocurrency markets are delivered live.
18.Multilingual versions
System makes change of languages easy. The language of charts depends on the language marked in the browser.


19. Additional functions
Additional tools make working with charts much easier. These include: zooming in, zooming out, magnifier, going to the end or beginning of a chart, export to a graphic file, crosshair, linear, logarithmic and percentage scale, autoscaling, price indicator.
Four things you have to compare before you choose Charts
BASIC
Your clients will be able to fully use all of the most important functions. You can choose the cheapest solution. Nevertheless you will be able to use the service of full value. The special feature of this product is enabling the space for the Exeria logo or advertisement in the bottom left corner of a chart.
PLUS
You can block ads in the chart, which allows you to keep all investors visiting your website. In addition, your customers will be able to use all the advanced features.
PROFIT
You will be able to use the product which gives you major independence. You will be able to put your own logo onto a chart or reap the benefits of earning money from ads. Your clients will also get valuable data live from the USA.
LIBRARY
You are choosing Premium solution. You will choose the full library as a fully available storeroom of charts as software. Later on, you will install them to be able to decide what functions you will use and for what purpose. You will be able to create any chart and also offer your own templates, strategies and indicators.
Would you like to learn more about our charts and the library?
Сomparison and summary of technical parameters
| Basic | Plus | Profit | Library | |
|---|---|---|---|---|
| Live US data | – | – | V | – |
| Live Forex, Crypto data | V | V | V | – |
| US data (15 min) | V | V | – | – |
| Custom logo | – | – | V | V |
| No ads | – | V | – | – |
| Monetization of advertising | – | – | V | V |
| Exeria logo | V | – | – | – |
| Technical analysis | V | V | V | V |
| A wide selection of charts | V | V | V | V |
| Quotes included with charts | V | V | V | V |
| Responsiveness | V | V | V | V |
| Smart Menu | V | V | V | V |
| Fast installation | V | V | V | V |
| The ability to build your own indicators | V | V | V | V |
| Chart templates | V | V | V | V |
| Smart Indicators | V | V | V | V |
| Smart Panel | V | V | V | V |
| Ability to load more historical data | V | V | V | V |
| The ability to open the chart in full screen | V | V | V | V |
| Investment strategies | V | V | V | V |
| Candlestick patterns | V | V | V | V |
| Auto refresh | V | V | V | V |
| Unlimited number of indicators | V | V | V | V |
| Data integrated into the chart | V | V | V | – |
| PL/EN version | V | V | V | V |
| Additional features | V | V | V | V |
| Custom templates | – | – | – | V |
| Custom quotes on the chart | – | – | – | V |
| Own ad space on the chart | – | – | – | V |
| Freedom of chart settings | – | – | – | V |
| Ability to place additional data on the chart | – | – | – | V |
| Possibility of creating an access hierarchy – e.g. through user logins | – | – | – | V |
| Save your own layouts for charts and indicators | – | – | – | V |
| Technical consultations | – | – | – | V |